Investment screens are a method to narrow the investment portfolio based on traits of the companies or securities available for investment. What does this mean in practice, and how does this work at Pathstone? This note will explain how Pathstone helps clients customize the design of their portfolios, from foundation (data), to building materials (methodology), to blueprint and execution (client preferences and Pathstone oversight), to ongoing maintenance.
Why Screen, and for What?
Screens are typically used to adjust the liquid portions of a portfolio to favor an investor’s preferences or values. They can also help enable the required diversification of an investor’s portfolio in the context of their full range of income and wealth-building activities.
An example of the former, Rabbinical Pension Board investment guidelines for those of the Jewish faith who ascribe to these principles will tend to avoid companies with significant revenues from private prisons and tobacco. Also, some investors may choose to screen out certain types of companies such as coal companies due to beliefs about investment returns or concerns about the environment. Likewise, investors might have concerns about the current conflict in Sudan and wish to avoid companies with economic ties to the region, potentially profiting from the dislocations there right now. Less common data points are available to screen for this issue.
Apart from values-based screens, some investors may need to screen out certain companies as a necessity. Employees of some companies are prevented from investing in the equity of their competitors. For instance, an executive of a building products company may have a clause in their employment agreement that disallows holdings in other building products companies. Alternatively, maybe that same executive has a large equity position in their company. To properly diversify their wealth, they may wish to screen out investments in the building products industry to avoid overexposure to that sector. As you can see, there are many reasons one would want to screen their investments.
The Foundation: Relevant Data
Underlying all investment screens is data about companies. Some data is disclosed by companies in response to regulations – for example, public companies must disclose earnings – and some countries require data such as carbon emissions. As another example, U.S. public companies with more than 100 employees are required to disclose the gender and ethnicity makeup of their workforce to the U.S. Department of Labor, and many companies also choose to disclose this information to investors.
Other data used in many screens capture inherent traits about companies, such as the sector they are in (e.g., energy, information technology) or sales from certain activities (e.g., weapons, or tobacco). This data is generally ‘static’ and readily available to investors and the public alike.
More complex data typically comes from third-party data providers. It can include information reported by companies, estimates, and scores assigned by the data vendors:
- In the case of reported information, this is generally captured using a survey. Data might be about governance or labor practices, environmental policies and impacts, or research and development expenses related to innovative new products/services that address a specific investment theme.
- In the case of estimates, data providers create and validate models for data points that companies do not report on. Examples of such cases are carbon emissions from generating electricity from different fossil fuels, or natural resource usage such as water and land use.
- Data scoring is based on the data providers’ proprietary methodologies, and results can vary widely. Understanding third-party data scoring requires a deep understanding of inputs and weights as well as possible biases in final scores. In general, the use of scoring requires the most discretion from investors in order to ensure that there is no unintentional bias introduced when screening potential investments.
Because information is coming from a third party, Pathstone considers it critical to ensure data points are legitimate. We conduct deep due diligence to vet whether the data providers have the resources and capabilities to ensure the data is accurate. This is why Pathstone has chosen the leading data providers in composing our screens: Morningstar, MSCI, and RepRisk. These firms have the most cogent methodologies for constructing their data collection and any calculations made, in our view. They also have vast teams to support their processes, including covering the widest number of companies and data points available.
Data licensed by Pathstone from these third parties serves as the foundation for how screens are composed. Data is updated daily, weekly, or quarterly, depending on the data point. Maintaining the data that underlies Pathstone screens is a dynamic process, with feeds continuously updated and monitored.
Building the Screen: Data + Values + Analysis
Using data as the base, Pathstone composes screens using leading investment research and analysis of the financial materiality of data, paired with clients’ expressed interests and values.
The third parties send Pathstone the data requested for the screens designed by Pathstone. Pathstone chooses the correct data point for the correct activity it is trying to filter out of/into a portfolio, then chooses a threshold or absolute value at which to create the filter.
A SIMPLE EXAMPLE: SCREENING OUT TOBACCO
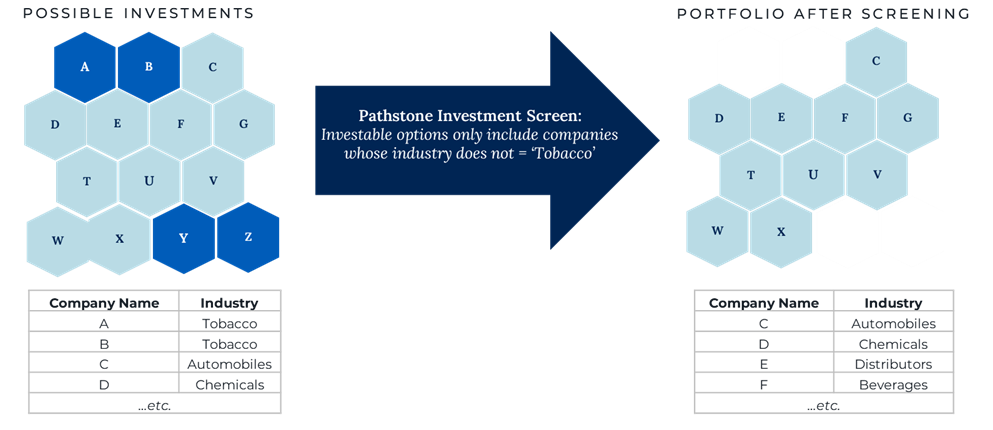
In some cases, screening certain companies by more inherent or static factors is simple. For instance, certain clients may desire to screen out all companies involved in tobacco – perhaps to align with their values, perhaps to diversify a concentrated legacy position in a tobacco company. This screen is relatively simple to apply:
- Companies A, B, Y, and Z are all tagged by MSCI as participating in the ‘Tobacco’ industry.
- This data is sent to Pathstone in bulk for all possible investments. Companies A, B, C, D, …. W, X, Y, Z are all in the investable universe of the strategy the investor has chosen to invest in.
- Only companies C, D, E, …. W, X end up in the portfolio after Pathstone identifies that A, B, Y, and Z are involved in tobacco and removes them from consideration for the client’s portfolio.

A MORE COMPLEX EXAMPLE: CARBON EMISSIONS
The screens for certain themes are a bit more challenging – requiring some discretion from Pathstone as to which data points to choose to best achieve the desired result, as well as the threshold value of the datapoint chosen to temper the companies filtered in / filtered out when the screen is selected.
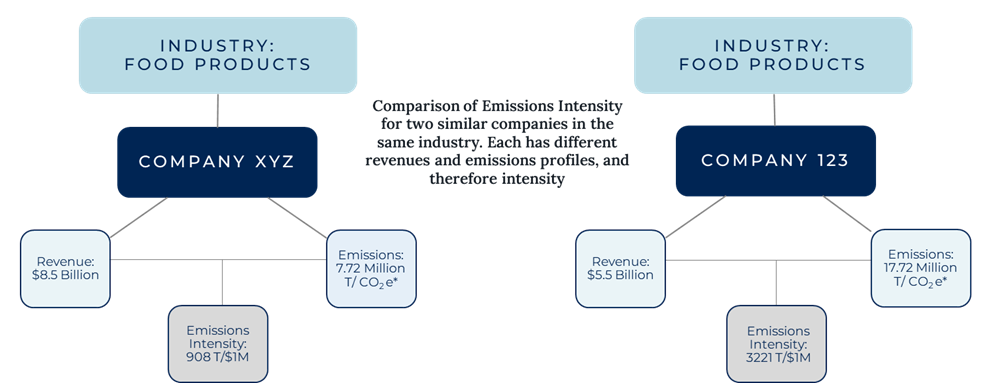
For example, the Intense Carbon Emissions screen from the Pathstone screening menu is composed using MSCI’s emissions intensity data point. Emissions intensity is the total of scope 1 and scope 2 carbon emissions of a company (i.e., emissions from the direct operations of the company plus emissions from purchased energy), re-weighted by the dollar amount from company revenues so that comparison between companies of different sizes is possible.

Pathstone’s research team analyzed the impact of filtering out companies for different thresholds of intense carbon emissions from this data point. The results of our analysis pointed towards recommending a slightly more restrictive 2,500 metric tons per million dollars of revenue. That equates to a cost of roughly $400 per ton of carbon. This is a very high price compared with the current range of $40-100 per ton in carbon trading markets, but it is consistent with high-end science-based estimates for the true economic and social cost of carbon emissions in the long run. Our screening choice resulted in filtering out heavy emitters, not only to align with science-based research but also to reflect potential rising market prices for carbon, which would negatively impact these emitters.
Using this filter, we apply the same process described in our simple “tobacco” example to all companies that have more than 2,500 metric tons per million in revenue; only those companies below this threshold remain available for investment.
Unlike a simply yes/no screen such as tobacco, screens that rely on a threshold value require a lot of analysis and decision-making to accurately filter on what the screen is meant to reflect. For instance, screens are regularly composed using a percentage of revenue associated with a certain revenue area. If the intention is to screen out nuclear power companies without eliminating companies that might have some involvement in nuclear but generate the vast majority of electricity using renewables, then it’s critical not to set the threshold value to ‘zero’ for revenue from nuclear power generation. In fact, this is how the nuclear power screen is composed at Pathstone – companies with more than 5% of revenue from nuclear power activities are filtered out, which allows utilities that have a wide range of generation sources (including renewables, gas, coal, etc.) to remain available for investment. The screening menu allows for further customization so investors can omit companies in other energy subsectors (gas, coal, or even pure-play renewables).
Refining and Executing the Blueprint: Full Process Flow and Investment
Pathstone offers 51 thematic screens and 77 industry screens composed of more than 210 underlying data points, in hundreds of combinations and thousands of individual different value thresholds. Composing all these screens requires a team of experts and thorough process validation and testing. Despite this complexity, the robust testing, validation, process, and infrastructure to support the process enables seamless execution for clients. From the client’s perspective, it really is as easy as checking a box.
To that end, if data is the foundation of the screens and Pathstone’s analysis is the framing of the building, the blueprint is set by Pathstone clients. Clients select their desired screens from the Pathstone Impact Investing Customization Menu. For example, clients can select from faith-based screens, screens that reflect environmental or social factors, or screens to aid in achieving a balanced portfolio in light of stock concentrations or prohibited holdings. Once clients express their intentions, behind the scenes the framework is fully in place to execute the screen automatically.
Pathstone’s sister company and execution partner, Concentric Innovation, then trades any companies whose profiles and respective data have changed and holds the remaining securities.

Part V. Ongoing Maintenance and Enhancements
These values alignment screening features are continuously monitored and improved between Pathstone and Concentric Innovation. As the partnership of Pathstone and Concentric Innovation, which joined forces in 2022, grows, we are excited to develop new advancements in sustainable and values-aligned investing for our clients.
Looking to the future, advancements in data availability and new data points will expand the range of ways Pathstone can offer clients to customize their portfolios to align their investments with their goals even more effectively. In time, we expect that will give clients the ability to choose new themes and customization options for investments inconsistent with their goals or beliefs, but possibly new ways to construct portfolios altogether – such as optimizing for sustainable opportunities.
Disclosures
This presentation and its content are for informational and educational purposes only and should not be used as the basis for any investment decision. The information contained herein is based on publicly available sources believed to be reliable but is not a representation, expressed or implied, as to its accuracy, completeness or correctness. No information available through this communication is intended or should be construed as any advice, recommendation or endorsement from us as to any legal, tax, investment or other matters, nor shall be considered a solicitation or offer to buy or sell any security, future, option or other financial instrument or to offer or provide any investment advice or service to any person in any jurisdiction. Nothing contained in this communication constitutes investment advice or offers any opinion with respect to the suitability of any security, and this communication has no regard to the specific investment objectives, financial situation and particular needs of any specific recipient. Past performance is no guarantee of future results. Additional information and disclosure on Pathstone is available via our Form ADV, Part 2A, which is available upon request or at www.adviserinfo.sec.gov.


