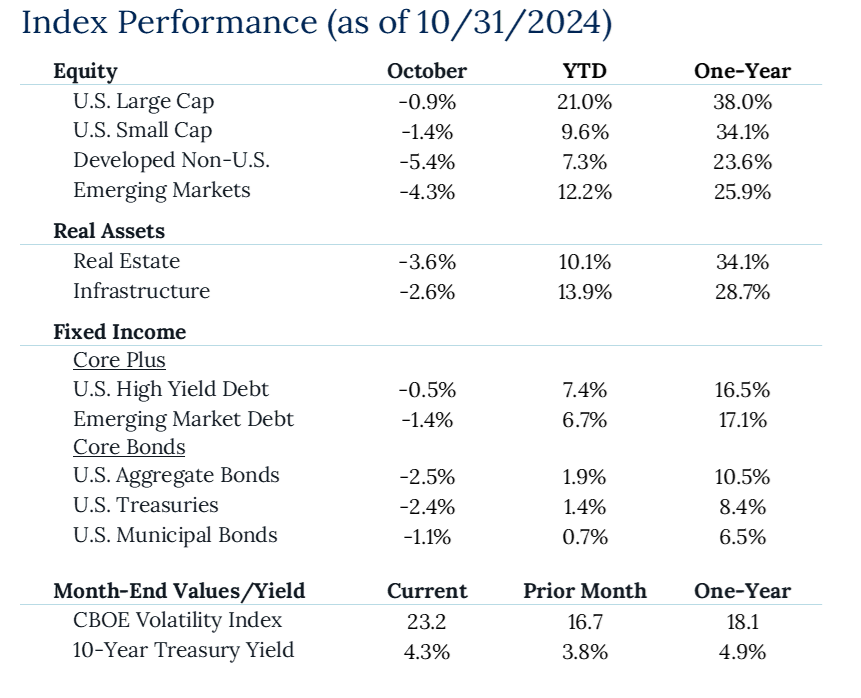
Market volatility overshadowed stellar economic growth figures for Q3, as real GDP continues to be above trend. Job growth slowed, but weekly jobless claims hit a five-month low, suggesting the payroll data may not fully reflect the underlying strength of the labor market. Commodity markets reflected global economic uncertainty, with gold and oil prices rising. Meanwhile, China’s economic growth slowed, prompting the government to announce stimulus measures. Market performance was broadly negative, with yields rising substantially as investors question whether the Fed will need to slow down the pace of rate cuts.
Key Takeaways
- Market News: The October economic landscape was characterized by rising market volatility. Resilient economic activity (+2.8% QoQ annualized) following the Fed’s initial outsized rate cut has market participants questioning whether the Fed will need to slow its pace. Treasury yields climbed to their highest since midJuly, which triggered a sell-off across stocks and bonds.
- Labor Market: October’s job growth slowed to just 12,000 new payrolls. This report was heavily impacted by hurricanes and the Boeing strike. However, weekly jobless claims hit a five-month low, which could signal that payroll growth was more reasonable than indicated.
- Global Tensions: Commodity markets reflected global economic uncertainty, with gold reaching fresh highs and up 30% year-to-date. Oil rose 3% in October after a volatile period of ebbs and flows related to the conflict in the Middle East. The U.S. dollar jumped versus other currencies in October which weighed heavily on Non-U.S. equity results for the month.
- China: Economic challenges continued for China, with Q3 growth expanding at 4.6%, below the government’s 5% target. The slowdown, driven by sluggish consumption and a property sector slump, prompted Beijing to announce significant monetary and fiscal stimulus. Chinese equity markets rallied on the initial announcement, however, equity markets gave up their momentum, ending down over 6% in October.

You cannot invest directly in an index; therefore, performance returns do not reflect any management fees. Returns of the indices include the reinvestment of all dividends and income, as reported by the commercial databases involved. Returns over one year have been annualized.
Source — Bloomberg, Morningstar, treasury.gov. S&P Dow Jones Indices.
Disclosures
Past Performance Is No Guarantee of Future Performance. Any opinions expressed are current only as of the time made and are subject to change without notice. This report may include estimates, projections or other forward looking statements, however, due to numerous factors, actual events may differ substantially from those presented. The graphs and tables making up this report have been based on unaudited, third-party data and performance information provided to us by one or more commercial databases. Additionally, please be aware that past performance is not a guide to the future performance of any manager or strategy, and that the performance results and historical information provided displayed herein may have been adversely or favorably impacted by events and economic conditions that will not prevail in the future. Therefore, it should not be inferred that these results are indicative of the future performance of any strategy, index, fund, manager or group of managers. While we believe this information to be reliable, Pathstone bears no responsibility whatsoever for any errors or omissions. Index benchmarks contained in this report are provided so that performance can be compared with the performance of well-known and widely recognized indices. Index results assume the re-investment of all dividends and interest. Moreover, the information provided is not intended to be, and should not be construed as, investment, legal or tax advice. Nothing contained herein should be construed as a recommendation or advice to purchase or sell any security, investment, or portfolio allocation. Any investment advice provided by Pathstone is client specific based on each clients’ risk tolerance and investment objectives. This presentation is not meant as a general guide to investing, or as a source of any specific investment recommendations, and makes no implied or express recommendations concerning the manner in which any client’s accounts should or would be handled, as appropriate investment decisions depend upon the client’s specific investment objectives.
U.S. Large Cap Equity is represented by the S&P 500 Index. U.S. Small Cap Equity is represented by the Russell 2000 Index. Developed Non-U.S. Equity is represented by the MSCI EAFE Index. Emerging Market Equity is represented by the MSCI EM Index. Real Estate is represented by the FTSE NAREIT Index. Infrastructure is represented by the FTSE Global Core Infrastructure 50/50 Index. U.S. High Yield Debt is represented by the Bloomberg Barclays U.S. Corporate High Yield Index. Emerging Market Debt is represented by the Bloomberg EM USD Aggregate Index. U.S. Aggregate Bonds is represented by the Bloomberg Barclays U.S. Aggregate Bond Index. U.S. Treasuries is represented by the Bloomberg Barclays U.S. Treasury Index. U.S. Municipal Bonds is represented by the Bloomberg Barclays Municipal 1-10yr Index.


