Markets bounced back in May, with U.S. equities ending a three-month losing streak and the Magnificent 7 delivering their best monthly gains in two years. U.S. equities have rebounded from the recent selloff, pushing the S&P 500 back into positive territory with a 1.1% gain on the year. After a string of stellar months, international equities have outperformed U.S. equities year-over-year, boosted by a weaker dollar. In fixed income, corporates outpaced Treasuries as spreads narrowed, and short duration performed well despite a sharp 30 basis point rise in the 2-year Treasury yield. Meanwhile, focus shifted from tariffs to fiscal concerns, as President Trump’s “One Big Beautiful Bill” stoked debate over national debt, driving inflation expectations, interest rates, and U.S. dollar volatility higher.

Key Takeaways

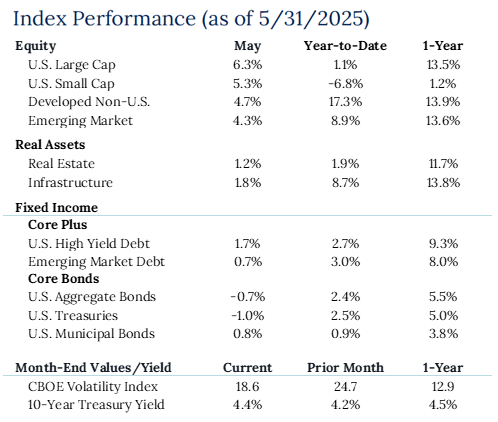
  • Market News: U.S. equities snapped a three-month losing streak, with both large and small caps posting solid gains. The Magnificent 7 delivered their best monthly performance in two years as growth outperformed value. U.S. stocks have rebounded from the recent selloff, and the S&P 500 now shows a modest gain of 1.1% YTD.
  • International Equities: Developed International equities continued their strength this year, supported by a weakening U.S. dollar. Emerging markets also rallied, driven by a surge in semiconductor stocks. On a 12-month basis, both Developed International and Emerging Markets are outperforming the S&P 500, something not seen since October 2023 and, before that, April 2018.
  • Fixed Income: Treasuries lagged corporates as credit spreads tightened, though they’re still having their strongest start to a year since 2020. Short duration outperformed, even as the 2-year Treasury yield jumped 30 basis points, its second-largest move higher since the first rate cut in September.
  • Fiscal Policy: While tariffs dominated headlines, attention turned toward President Trump’s proposed “One Big Beautiful Bill.” Though not yet finalized, the plan has raised concerns about rising debt levels, contributing to higher inflation expectations, upward pressure on rates, and renewed scrutiny of the U.S. dollar.

You cannot invest directly in an index; therefore, performance returns do not reflect any management fees. Returns of the indices include the reinvestment of all dividends and income, as reported by the commercial databases involved. Returns over one year have been annualized.

Source — Sources: Bloomberg, Pathstone

Disclosures

Past Performance Is No Guarantee of Future Performance.  Any opinions expressed are current only as of the time made and are subject to change without notice. This report may include estimates, projections or other forward looking statements, however, due to numerous factors, actual events may differ substantially from those presented. The graphs and tables making up this report have been based on unaudited, third-party data and performance information provided to us by one or more commercial databases. Additionally, please be aware that past performance is not a guide to the future performance of any manager or strategy, and that the performance results and historical information provided displayed herein may have been adversely or favorably impacted by events and economic conditions that will not prevail in the future. Therefore, it should not be inferred that these results are indicative of the future performance of any strategy, index, fund, manager or group of managers. While we believe this information to be reliable, Pathstone bears no responsibility whatsoever for any errors or omissions.  Index benchmarks contained in this report are provided so that performance can be compared with the performance of well-known and widely recognized indices. Index results assume the re-investment of all dividends and interest. Moreover, the information provided is not intended to be, and should not be construed as, investment, legal or tax advice. Nothing contained herein should be construed as a recommendation or advice to purchase or sell any security, investment, or portfolio allocation. Any investment advice provided by Pathstone is client specific based on each clients’ risk tolerance and investment objectives. This presentation is not meant as a general guide to investing, or as a source of any specific investment recommendations, and makes no implied or express recommendations concerning the manner in which any client’s accounts should or would be handled, as appropriate investment decisions depend upon the client’s specific investment objectives.

U.S. Large Cap Equity is represented by the S&P 500 Index. U.S. Small Cap Equity is represented by the Russell 2000 Index. Developed Non-U.S. Equity is represented by the MSCI EAFE Index. Emerging Market Equity is represented by the MSCI EM Index. Real Estate is represented by the FTSE NAREIT Index. Infrastructure is represented by the FTSE Global Core Infrastructure 50/50 Index. U.S. High Yield Debt is represented by the Bloomberg Barclays U.S. Corporate High Yield Index. Emerging Market Debt is represented by the Bloomberg EM USD Aggregate Index. U.S. Aggregate Bonds is represented by the Bloomberg Barclays U.S. Aggregate Bond Index. U.S. Treasuries is represented by the Bloomberg Barclays U.S. Treasury Index.  U.S. Municipal Bonds is represented by the Bloomberg Barclays Municipal 1-10yr Index.

Ready to start a conversation?

SIGN UP FOR OUR MARKET UPDATE NEWSLETTER