Market turbulence defined the first quarter of the year as a clear divide emerged between struggling US equities and surging international markets. While domestic growth stocks faltered significantly, European and Chinese equities delivered their strongest comparative performance in decades. Real assets proved to be a bright spot with impressive gains across commodities, metals, and infrastructure. Meanwhile, economic uncertainty grows under new trade policies, despite resilient employment numbers. Though some underlying fundamentals remain positive, waning consumer confidence and rising inflation expectations present notable headwinds for investors navigating this complex landscape.
Key Takeaways
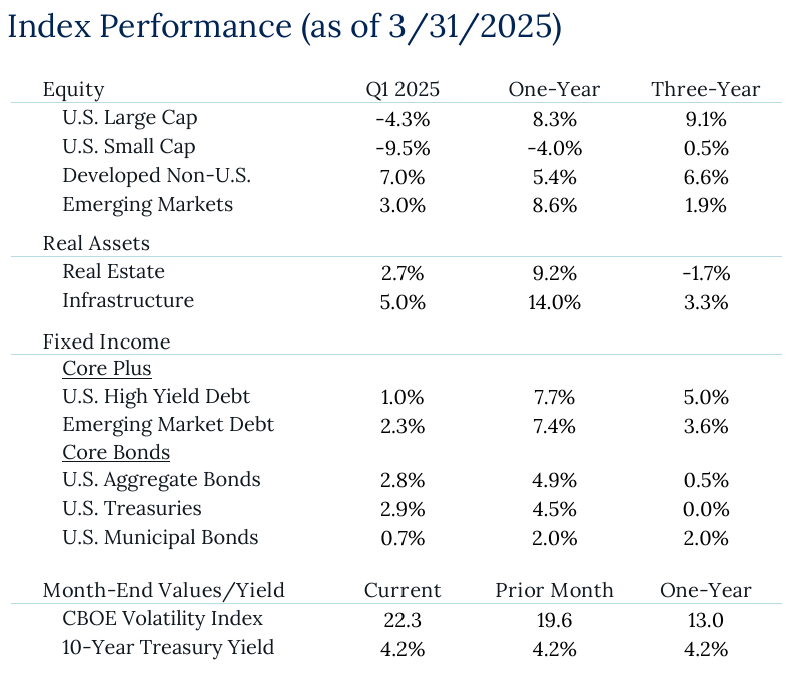
- Growth Struggles: US Large Cap performance suffered due to growth stock weakness, with the Russell 1000 Growth Index down -10% and the Magnificent 7 falling -16% for the quarter. Energy stocks emerged as sector leaders with over 10% gains, while Technology and Consumer Discretionary sectors lagged significantly, each declining more than 10%.
- International Strength: International equities delivered exceptional performance relative to US markets, marking one of the best comparative quarters since the early 2000s. European equities achieved their strongest relative performance since the mid-1980s, rising 10.5%, while Chinese equities surged 15%. This outperformance was supported by a nearly 4% depreciation in the dollar index during Q1.
- Small Cap Challenges: US Small Caps endured another disappointing quarter, contributing to the worst month of combined performance with US Large Caps since September 2022. Meanwhile, implied market volatility stands nearly double than where it was at this point last year, reflecting ongoing investor uncertainty.
- Real Asset Rally: Commodities and other real assets delivered impressive returns in Q1, with broad commodities gaining nearly 9%, gold surging 18%, and copper jumping over 25%. REITs and infrastructure also performed well, rising 2.75% and 5% respectively, while TIPs outperformed non-inflation protected treasuries and were up 4.2% for the quarter as re-inflation fears rose.

You cannot invest directly in an index; therefore, performance returns do not reflect any management fees. Returns of the indices include the reinvestment of all dividends and income, as reported by the commercial databases involved. Returns over one year have been annualized.
Source — Bloomberg, Morningstar, treasury.gov, S&P Dow Jones Indices.
Quarterly Commentary
- Fiscal Policy: The first quarter of 2025 has been marked by significant fiscal turbulence under the Trump administration. Aggressive trade policies, including sweeping tariffs on major trading partners like Canada, Mexico, and China, have created an atmosphere of economic uncertainty. These tariffs have not only shifted the balance of international trade relations but also raised concerns about potential economic disruption. The administration’s rapid policy shifts and executive orders have left businesses and investors on edge.
- Monetary Policy: Federal Reserve officials are treading carefully in this complex economic environment. Chair Jay Powell has repeatedly emphasized that the central bank is “not in a hurry” to cut interest rates, citing “unusually elevated” uncertainty. The Fed has adjusted its growth forecasts downward and lifted inflation outlooks, directly acknowledging the potential impact of the administration’s trade policies. Their primary focus remains on maintaining economic stability while monitoring the potential inflationary pressures from new tariffs.
- Labor Market: The job market has shown remarkable resilience in the face of potential disruption. While job creation has slowed, the unemployment rate has remained relatively stable around 4.1%. However, there are warning signs, including federal government job cuts and rising unemployment fears among consumers. Increasing uncertainty puts the employment stability we have been enjoying in the U.S. at risk.
- Consumer Sentiment and Spending: Consumer confidence has taken a significant hit in Q1 2025. The University of Michigan’s consumer sentiment index has dropped to its lowest level since 2022, with consumers expressing deep concerns about unemployment, inflation, and overall economic conditions. Retail sales have shown modest growth, but the underlying sentiment suggests consumers are becoming more cautious. The on-again, off-again nature of policy announcements has contributed to a growing sense of economic unpredictability.
- Inflation: Inflation remains a key watchpoint for economic observers. While the annual inflation rate has fallen to 2.8% in February, consumer expectations for future inflation have risen sharply. Consumers now anticipate prices to increase by nearly 5% in the next year, the highest level since 1993. The potential inflationary impact of new tariffs continues to loom large in economic discussions.
- Outlook: While the economic landscape of Q1 2025 presents significant challenges, there are reasons for moderate optimism. The underlying economic fundamentals remain resilient, with steady job creation and signs of adaptability. However, poor sentiment can be a strong driver of spending for individuals and companies. Investors and businesses must remain vigilant, carefully navigating the complex interplay of trade policies, monetary strategy, and global economic dynamics.
Download the pdf to view the full report.
Disclosures
Past Performance Is No Guarantee of Future Performance. Any opinions expressed are current only as of the time made and are subject to change without notice. This report may include estimates, projections or other forward looking statements, however, due to numerous factors, actual events may differ substantially from those presented. The graphs and tables making up this report have been based on unaudited, third-party data and performance information provided to us by one or more commercial databases. Additionally, please be aware that past performance is not a guide to the future performance of any manager or strategy, and that the performance results and historical information provided displayed herein may have been adversely or favorably impacted by events and economic conditions that will not prevail in the future. Therefore, it should not be inferred that these results are indicative of the future performance of any strategy, index, fund, manager or group of managers. While we believe this information to be reliable, Pathstone bears no responsibility whatsoever for any errors or omissions. Index benchmarks contained in this report are provided so that performance can be compared with the performance of well-known and widely recognized indices. Index results assume the re-investment of all dividends and interest. Moreover, the information provided is not intended to be, and should not be construed as, investment, legal or tax advice. Nothing contained herein should be construed as a recommendation or advice to purchase or sell any security, investment, or portfolio allocation. Any investment advice provided by Pathstone is client specific based on each clients’ risk tolerance and investment objectives. This presentation is not meant as a general guide to investing, or as a source of any specific investment recommendations, and makes no implied or express recommendations concerning the manner in which any client’s accounts should or would be handled, as appropriate investment decisions depend upon the client’s specific investment objectives.
U.S. Large Cap Equity is represented by the S&P 500 Index, with dividends reinvested. U.S. Small Cap Equity is represented by the Russell 2000 Index. Developed Non-U.S. Equity is represented by the MSCI EAFE Index. Emerging Market Equity is represented by the MSCI EM Index. Real Estate is represented by the FTSE NAREIT Index. Infrastructure is represented by the FTSE Global Core Infrastructure 50/50 Index. U.S. High Yield Debt is represented by the Bloomberg Barclays U.S. Corporate High Yield Index. Emerging Market Debt is represented by the Bloomberg EM USD Aggregate Index. U.S. Aggregate Bonds is represented by the Bloomberg Barclays U.S. Aggregate Bond Index. U.S. Treasuries is represented by the Bloomberg Barclays U.S. Treasury Index. U.S. Municipal Bonds is represented by the Bloomberg Barclays Municipal 1-10yr Index.