Quarterly Market Flash Report - Q4 2024

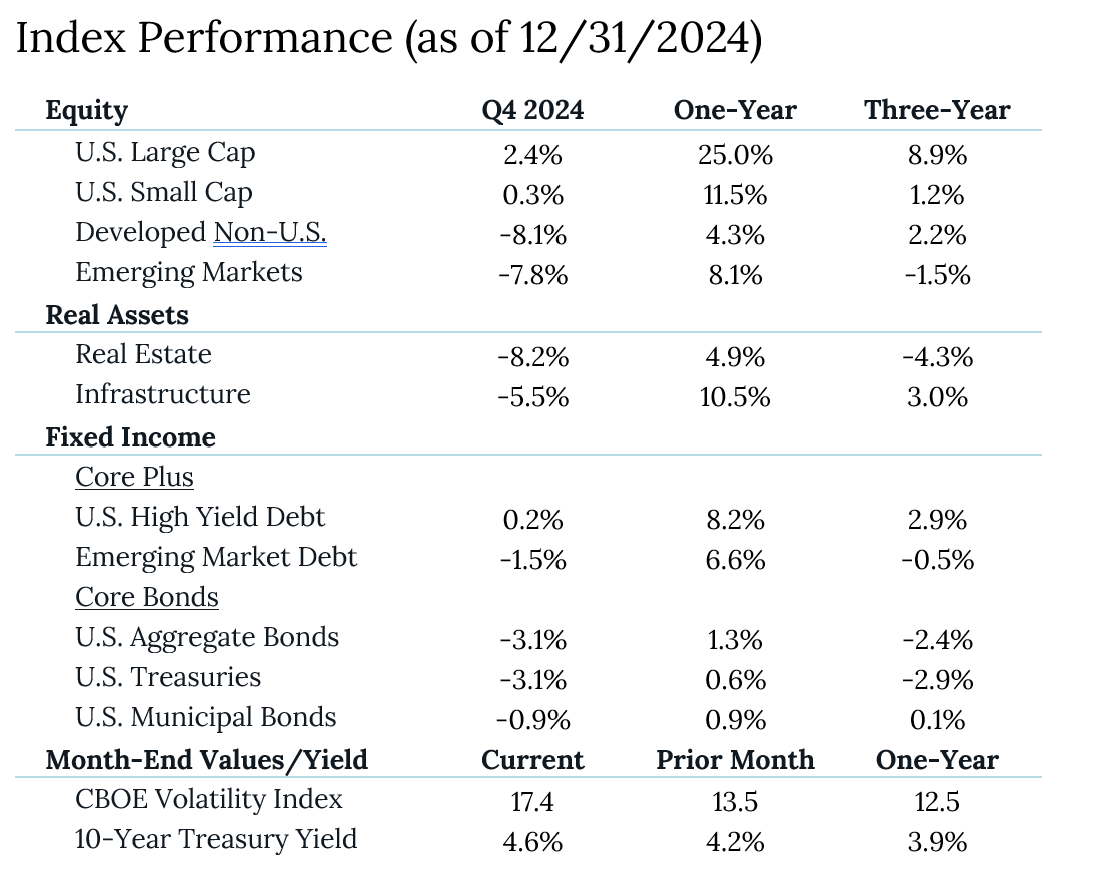
Despite market volatility in December, the fourth quarter of 2024 showcased the continued dominance of US equities, particularly in the Large Cap Growth segment, which posted an impressive 7.1% gain. This outperformance came amid significant market divergences, with developed international markets declining as the U.S. dollar strengthened and fixed income markets struggling as the 10-year Treasury yield climbed to 4.6% on worries about inflation and rising government debt. The U.S. economy demonstrated remarkable resilience, with strong holiday consumer spending and robust labor market data. However, persistent inflation prompted the Federal Reserve to maintain a more hawkish stance even while implementing its third consecutive rate cut to 4.25-4.5%. Given the combination of strong economic fundamentals and ongoing policy challenges, markets appear poised for continued complexity as we enter 2025.

Key Takeaways

  • US Dominance: The S&P 500’s modest -2.4% monthly decline in December masks a significant divergence from global markets, as US equities continued to outperform international peers across market caps and styles. While developed international markets fell -2.3% for the month, their quarterly decline of -8.1% highlights the sustained strength of US market but also the strength of the US dollar.
  • Growth Leadership: Large Cap Growth stocks demonstrated remarkable resilience with a 0.9% monthly return for December and 7.1% gain for Q4, dramatically outperforming Value’s -6.8% monthly and -2.0% quarterly declines. This performance gap underscores the ongoing market preference for strong growth prospects as rates stay high.
  • Small Cap Struggle: Small cap stocks faced significant headwinds with a sharp -8.3% monthly decline, though managing a slight 0.3% quarterly gain, highlighting the challenging environment for smaller companies. Investors are conflicted and thought we would see a more significant rotation into small caps as rates were cut. Policy uncertainty caused the long-end of the yield curve to rise, cutting expectations for these firms.
  • Fixed Income Pressure: The fixed income market reflected ongoing rate uncertainty, with long-term Treasury bonds declining -6.4% in December and -9.7% for the quarter, as the 10y Treasury yield moved from 3.9-4.6% during the quarter. Bond returns for the year were more muted than expected given the high starting point for yields and the 10y Treasury yield will start 2025 higher than at the start of 2024.

You cannot invest directly in an index; therefore, performance returns do not reflect any management fees. Returns of the indices include the reinvestment of all dividends and income, as reported by the commercial databases involved. Returns over one year have been annualized.

Source — Bloomberg, Morningstar, treasury.gov, S&P Dow Jones Indices.

Quarterly Market Report Commentary

  • Labor Market: The US labor market showed remarkable resilience in November, with nonfarm payrolls increasing by 227,000 jobs, exceeding economist expectations of 200,000 and marking a substantial recovery from October’s hurricane and strike-affected numbers. This strength was further evidenced by job openings rising to 7.7 million in October, with voluntary quit rates increasing, suggesting workers remain confident in their ability to find new employment. While the unemployment rate edged up slightly to 4.2%, the overall labor market dynamics continue to demonstrate fundamental strength despite higher levels of interest rates. 
  • Consumer Spending: The American consumer demonstrated exceptional strength during the holiday shopping season, shattering previous spending records across both traditional retail and online channels during the critical Thanksgiving period. This surge in consumer activity, which significantly exceeded expectations across multiple shopping days and categories, suggests that despite some economic headwinds, American shoppers remain confident and willing to spend.
  • Inflation: The Consumer Price Index reached 2.7% in November, building on October’s uptick and remaining stubbornly above the Federal Reserve’s 2% target. Core CPI, which excludes volatile food and energy prices, registered at 3.3% annually, while the Fed’s preferred measure, PCE inflation, rose to 2.4% in November. Persistent inflationary pressure coupled with policy uncertainty are influencing the Federal Reserve’s approach to monetary policy as we head into 2025.
  • Monetary Policy: The Federal Reserve responded to these economic conditions by implementing its third consecutive quarter-point rate cut, bringing the benchmark rate to 4.25-4.5%. However, the central bank’s more hawkish messaging regarding future rate cuts has sparked significant market reactions, including a surge in the 10y Treasury yield and the US dollar along with increased equity market volatility. The Fed’s cautious stance reflects ongoing concerns about inflation persistence and suggests a more measured approach to monetary easing in 2025 than previously anticipated.
  • US Budget: The government debt market is showing signs of stress, with major investment managers like Pimco reducing exposure to long-term US government debt due to sustainability concerns and inflation risks. The 10-year Treasury yield climbed to a high of 4.62% in December, its highest level in over six months, reflecting market participants’ adjustment to the Fed’s more conservative rate cut projections and broader concerns about fiscal dynamics.
  • Looking ahead, the economic landscape presents a complex picture of resilience and risk. While labor market strength and consumer confidence provide a solid foundation, persistent inflation, higher rates, and policy uncertainty suggest potential challenges ahead. The Federal Reserve’s more measured approach to rate cuts reflects this delicate balance, emphasizing the need for continued vigilance in navigating the current market environment.  

Download the pdf to view the full report.

Disclosures

Past Performance Is No Guarantee of Future Performance.  Any opinions expressed are current only as of the time made and are subject to change without notice. This report may include estimates, projections or other forward looking statements, however, due to numerous factors, actual events may differ substantially from those presented. The graphs and tables making up this report have been based on unaudited, third-party data and performance information provided to us by one or more commercial databases. Additionally, please be aware that past performance is not a guide to the future performance of any manager or strategy, and that the performance results and historical information provided displayed herein may have been adversely or favorably impacted by events and economic conditions that will not prevail in the future. Therefore, it should not be inferred that these results are indicative of the future performance of any strategy, index, fund, manager or group of managers. While we believe this information to be reliable, Pathstone bears no responsibility whatsoever for any errors or omissions.  Index benchmarks contained in this report are provided so that performance can be compared with the performance of well-known and widely recognized indices. Index results assume the re-investment of all dividends and interest. Moreover, the information provided is not intended to be, and should not be construed as, investment, legal or tax advice. Nothing contained herein should be construed as a recommendation or advice to purchase or sell any security, investment, or portfolio allocation. Any investment advice provided by Pathstone is client specific based on each clients’ risk tolerance and investment objectives. This presentation is not meant as a general guide to investing, or as a source of any specific investment recommendations, and makes no implied or express recommendations concerning the manner in which any client’s accounts should or would be handled, as appropriate investment decisions depend upon the client’s specific investment objectives.  

U.S. Large Cap Equity is represented by the S&P 500 Index, with dividends reinvested. U.S. Small Cap Equity is represented by the Russell 2000 Index. Developed Non-U.S. Equity is represented by the MSCI EAFE Index. Emerging Market Equity is represented by the MSCI EM Index. Real Estate is represented by the FTSE NAREIT Index. Infrastructure is represented by the FTSE Global Core Infrastructure 50/50 Index. U.S. High Yield Debt is represented by the Bloomberg Barclays U.S. Corporate High Yield Index. Emerging Market Debt is represented by the Bloomberg EM USD Aggregate Index. U.S. Aggregate Bonds is represented by the Bloomberg Barclays U.S. Aggregate Bond Index. U.S. Treasuries is represented by the Bloomberg Barclays U.S. Treasury Index.  U.S. Municipal Bonds is represented by the Bloomberg Barclays Municipal 1-10yr Index.

Offices

Scottsdale, AZ

Contact & Locations

Los Angeles, CA

Contact & Locations

Lakewood, CO

Contact & Locations

Alexandria, VA

Contact & Locations

Maryland

Contact & Locations

Naples, FL

Contact & Locations
Street view of Winter Park Florida Pathstone Office

Winter Park, FL

Contact & Locations

Atlanta, GA

Contact & Locations

Boston, MA

Contact & Locations

Englewood, NJ

Contact & Locations
Aerial view of New York City

New York, NY

Contact & Locations

Providence, RI

Contact & Locations

Austin, TX

Contact & Locations

Bellevue, WA

Contact & Locations

Seattle, WA

Contact & Locations